
Bitcoin Boot Camp - Technical Analysis Series
21 Sep, 2019 James Dice
Have you ever spent just a little too much time looking at your charts and missed out on profit or took a loss? Next time, you’ll be ready to trade with confidence more quickly by learning about some of the key signals which I use in cryptocurrency trading. This series is intended for newcomers and casual traders who would like to eliminate emotions and maximize profits more often by learning about technical analysis.
Often I am surprised at just how effective trading with the RSI/MACD as primary signals can be. Of course I understand the logic, but it still feels like sorcery when it works well. Each of these concepts are simple to learn individually, and using them in conjunction can save you a lot of time which means that you can react faster and make fewer mistakes. I’ll start by explaining each element by themselves and then bring them together in an actual Bitcoin/USD chart to demonstrate how they paint a more complete picture of the true value of the currency, market sentiment, and likely future movement.
MACD - Moving Average Convergence/Divergence
The MACD is a movement oscillator, meaning it moves up and down about a zero value. While many other oscillators are used to identify overbought or oversold conditions, the MACD is more useful for identifying if there is a market trend. Oscillators typically plot some value over time between two bounds. The MACD outputs relative floating point numbers and is unbounded however. Interestingly, the MACD was invented by a renowned nephrologist, Gerald B. Appel, M.D., Ph.D in the late 1970’s. In this case, the MACD takes three time series samples and plots how much of a trend there is.
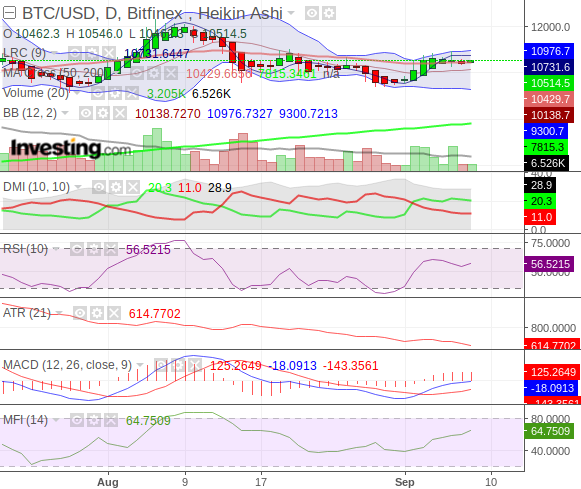
Fig. 1 - MACD as compared to other indicators on a typical 1 day chart of BTC.
Note the MACD indicates a downward trend clearly, followed by crossovers signaling reversal.
Quoting Fidelity Investments’ very succinct explanation, “An approximated MACD can be calculated by subtracting the value of a 26 period Exponential Moving Average (EMA) from a 12 period EMA. The shorter EMA is constantly converging toward, and diverging away from, the longer EMA. This causes MACD to oscillate around the zero level. A signal line is created with a 9 period EMA of the MACD line.”
In simpler terms, the short period average as compared to the longer period average will diverge, converge, and change angle corresponding to what the market is doing now in relation to what it has done recently. This creates a clear signal and a visible trend line. While this may not be enough by itself, it can be useful when compared with other indicators like the Relative Strength Index. MACD crossovers occur with a delay because of the behavior of moving averages, so maximizing your performance will require reading other signals as well. Observe that the MACD crossover occurs roughly at the RSI midpoint. This means that if you wait for crossovers before trading you will miss out on profits.
On the Monetary Flow Index in Fig. 1, you will see that more trading happens slightly before the crossover and actually corresponds more closely to the RSI crossing the key value of 20-30, where many traders see the trading instrument as being at a ‘dip’ in its value. These traders are anticipating the crossover, not reacting to it. This is a gamble, but it roughly doubles your potential profit on the average trade. “Buy the dips” is good advice, but the MACD trend can tell you if the instrument is headed for a lower dip or leveling out. If I do not have a reason to believe the instrument is going to fall further in price, it is trending upward past 30 on the RSI, I see convergence on the MACD coming, and the MA Cross does not indicate the current short average is too far above the MA Cross long average (which may mean the currency is trading at too high a price), then I will often buy and wait for the next peak. An RSI falling below 70/80 with a downward or cresting MACD trend may be a good signal to sell and wait for the dip once again. Some traders prefer to use 20/80 for the RSI critical values, but I use 30/70 to filter out confusing fluctuations at the extremes, especially in intraday trading.
Future articles in this series will expound on the RSI, MFI, MA Cross, and other indicators in more detail. For now, I hope this helps clarify what the MACD is and how it can be useful. Even if you don’t use it for a primary indicator, it does provide a quick at-a-glance reference for sanity checking when you might otherwise think there is a trend which is not really there. Be sure to check your dailies, hourlies, and by the minute charts before trading and don’t get tunnel vision. See you soon with more information. If you have comments, questions, or suggestions regarding this article, please feel free to discuss them in the comment section below. Thanks for reading, trade safe!
IMPORTANT: Please understand that I am not a licensed or registered financial or investment advisor. This proceeding is an opinion provided for informational purposes only. No part of this is intended to be financial or investment advice. Cryptocurrency trading is one of the riskiest things you can do with your money. There will always be factors which you cannot predict or control which can cause catastrophic losses at any time. Seek an appropriately credentialed professional in your jurisdiction for investment advice, or become one yourself.
Remember: Do not risk what you cannot afford to lose, unless you doing simulated cryptocurrency trading on Niffler.

James Dice
James 'Bunni' Dice's protean background includes cryptocurrency market analysis, data science, trading, technical writing. He is also interested in AI and automation solutions.
Related articles
The Benefits of Using a Crypto Trading Simulator Before Investing
In this article, we will take a deep dive into the world of trading simulators and how they have been adopted within the emerging cryptocurrency asset class.…
2mins 26 Jan, 2021 CryptoParrotTesting a DigiByte Cost Averaging Strategy on Niffler - Part 2 - Exit
After CryptoSurf’s four month DigiByte Cost Averaging experiment on the Niffler simulated exchange, check out his final exit strategy.…
2mins 14 Apr, 2019 CryptoSurfTesting a BTC/USD Rebalancing Strategy
Rebalancing is a strategy that consists in periodically buying or selling assets in a portfolio to maintain an original desired level of asset allocation.…
2mins 27 Feb, 2019 CryptoSurfTesting a DigiByte Cost Averaging Strategy on Niffler - Part 1 - Accumulation
Cost Averaging might be one of the best strategies when it comes to position trading or investing and to try and outperform most short-term traders in the long run.…
2mins 18 Feb, 2019 CryptoSurfStart trading
Recommended crypto exchange
Buy & sell Crypto in minutes
Learn moreComments